|
How a Baseline Model is Calculated |


|
rev. 2015-04-17

|
|
|
How a Baseline Model is Calculated |
|
|
rev. 2015-04-17
|
|
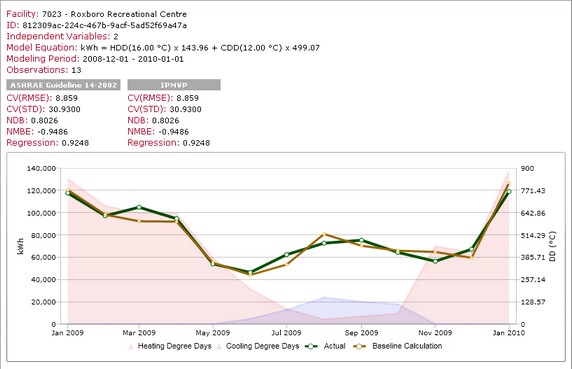
To best understand how a baseline model is calculated, it is best to look at IPMVP Volume 1 or ASHRAE Guideline 14-2002.
The baseline in ManagingEnergy is a mathematical model which attempts to predict utility consumption within the baseline reference period. The baseline reference period for the electrical meter below was 2009-01-01 to 2010-01-01. In creating the baseline, the software looks at the actual consumption (green line) during this period and attempts to correlate it to weather and other factors. The image below (from the advanced analysis module of ManagingEnergy) shows the actual consumption in green and the baseline model in gold.
Now that we have the baseline model, let us focus the attention on the Performance graph. Again, the green line represents actual monthly consumption obtained from meter readings or invoices. The gold line is the baseline, but this time it is adjusted to the conditions of the reported month, such as how hot or cold it was. Outside of our baseline reference period this line represents what would have been consumed if the building was performing/operating exactly the way it had been during the baseline reference period (2009-01-01- 2010-01-01). Under the hood we accomplish this by plugging heating/cooling loads – measured in heating and cooling degree days – into the baseline model equation for the period of interest. The blue line is similar to the gold except we are using the conditions expected in a typical year based on published statistical weather data for North America.
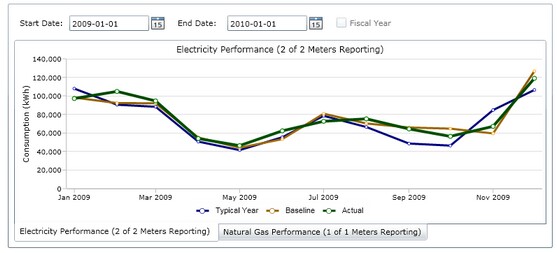
From the above graph you can answer the following questions:
| 1) | Is my building performing better than it was during the baseline reference period? – Yes if the green line is below the gold (since the gold line is adjusted to the conditions of the green allowing for an apples to apples comparison) |
| 2) | How does this year’s consumption compare to a typical or average year? – Compare the green line to the blue line. |
| 3) | Is my building retrofit reducing utility consumption? - Make the year leading up to the completion of the retrofit the baseline reference period for each of the affected meters. Compare the green and gold lines in the post retrofit period. If the retrofit is reducing utility consumption you should see the green line consistently below the gold. |