|
Outputs - Dashboards, Reports, Exports |


|
rev. 2015-05-12

|
|
|
Outputs - Dashboards, Reports, Exports |
|
|
rev. 2015-05-12
|
|
ManagingEnergy supports three types of user outputs: Dashboards, Reports and Exports.
Data Availability for Reporting
ManagingEnergy is not a meter reading application. Rather it receives input data from other business processes, which are often not fully automated, so a time lag is expected between the moment a meter reading occurs and the moment that reading is entered into ManagingEnergy. System administrators do not want to create confusion by exposing users to partial information, so the normal practice is to wait until the great majority of meter readings have been collected and entered. Lag times vary among accounts and meters. When an organization is dealing with thousands of meter, it can take a number of days before the data is sufficiently whole.
ManagingEnergy uses a default display lag of 120 days before presenting data for each calendar or fiscal year. that means a user will not be able to select a year-end report until 3 months after the year has ended. Individual users can be configured to see outputs earlier, at the risk that the information will be incomplete.
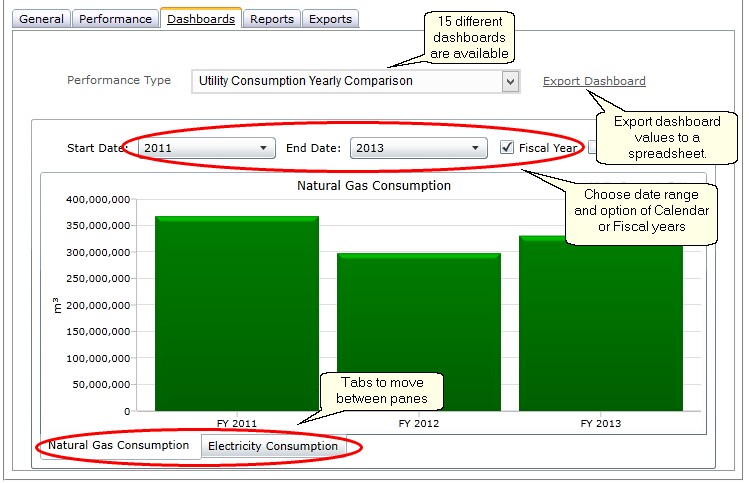
Dashboards
Dashboards are on-screen graphic displays, available under the Dashboards tab in the work area of the screen. Use the top pulldown to pick the dashboard, and use the two date pull-downs to select any range of calendar or fiscal years. Hover over the graph area to see values and use the tabs at the bottom to move between available panes.
Reports
Reports are graphic outputs in Adobe *.pdf file format, normally a combination of graphics and tables.
Exports
Exports are MS Excel workbooks containing tables of values. Exports are useful for further analysis or integration with other systems that work with spreadsheets.
The following sections list the Reports and Exports that come prepackaged with ManagingEnergy.